
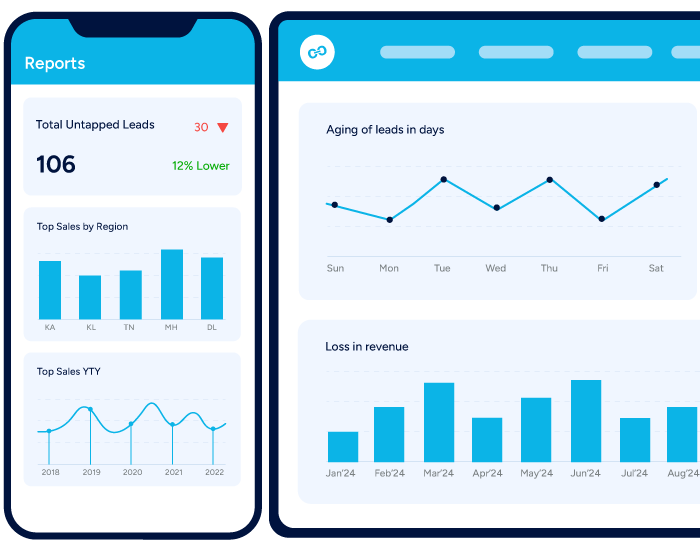
Identify sales gaps
Detailed insight into every stage of the sale shows exactly where the team can optimise and where a small fix converts into more closures.
- Step-level timing
- Queue versus work split
- Optimisation shortlist
Measure the time from lead creation to closure at every step, cut the delays that cost you deals, and hold each stage to an SLA people can actually see.
TAT breakdown - last 30 days
9,318 closed journeys
-31% YoY
2.1 days
+9 pts
needs action
Average time per stage (days)
Breaches today
Verification SLA
96 files past 48 hrs
Document upload
71 files past 24 hrs
Approval queue
47 files past 36 hrs
Total cycle time is an average. TAT analysis shows the individual steps that create it.
Which step adds the most days to the journey?
Is the delay with the customer, the rep or an internal queue?
Which branches consistently beat the SLA, and how?
How much revenue is sitting behind SLA breaches right now?
Has TAT improved since the last process change?
Timestamps are captured at every state change, so the maths is not an estimate.
Configurable to your workflowEnd-to-end TAT
Elapsed time from lead creation to final closure or disbursal.
Track the headline promise to customers
Stage TAT
Time consumed inside each individual stage of the workflow.
Attack the slowest step first
Waiting versus working
Split between time in a queue and time in active work.
Add capacity where queues form
SLA adherence
Share of journeys completing each stage within the agreed limit.
Make service levels enforceable
Breach ageing
How long open breaches have been outstanding, by owner.
Clear the oldest first
Cohort comparison
TAT by product, branch, channel, ticket size and period.
Find the pattern behind the delay
Analyse the data on time spent from lead creation to closure, reduce TAT and convert more of the same pipeline.
Detailed insight into every stage of the sale shows exactly where the team can optimise and where a small fix converts into more closures.
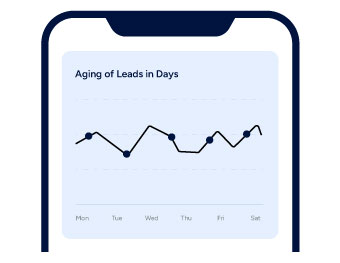
Immediate access to TAT analytics gives leadership a live read on deal closure velocity and lets you measure growth instantly.
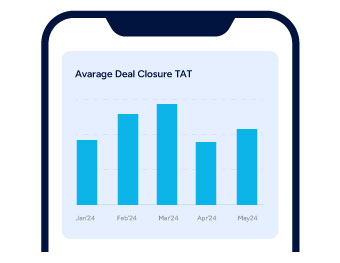
Capture field agent performance in real time and improve turnaround for every stage and every closure.
A turnaround target that nobody is told about is not a target.
The owner is notified the moment a stage crosses its SLA.
Unresolved breaches climb the hierarchy automatically.
A stage trending slower week over week is flagged early.
Field rep
Their own breaches, oldest first, with the action needed.
Operations
Queue depth and waiting time by step and by branch.
CXO
TAT trend against plan with product and region drilldowns.
Reported continuously so improvement is measurable, not anecdotal.
Open breaches by stage and owner, refreshed continuously.
Yesterday's adherence and today's at-risk files.
Before and after views for every process change.
Stage timestamps exported for regulatory or audit reporting.
Analytics & Business Intelligence
Dashboards, drilldowns and scheduled reporting on web and mobile.
ViewLive Sales Metrics
Target versus achievement in real time, on the rep's phone.
ViewStage Wise Performance Report
Conversion and ageing at every stage of the funnel.
ViewUntapped Leads Report
Every lead nobody has touched, with the owner named.
ViewLeads Activity Report
The full engagement trail behind each lead and customer.
ViewA TAT analysis report measures the elapsed time from lead creation to closure and breaks it down stage by stage. Toolyt captures a timestamp at every state change, splits waiting time from working time, tracks SLA adherence per stage, alerts owners the moment a breach happens and compares TAT across products, branches and periods.
Quick answers about how Toolyt works for field sales, lending and service teams.
Talk to our teamSales professionals from startups to Fortune 500 companies in over 20 countries improve their productivity with Toolyt every day.